Threat Stack Cloud Security Platform
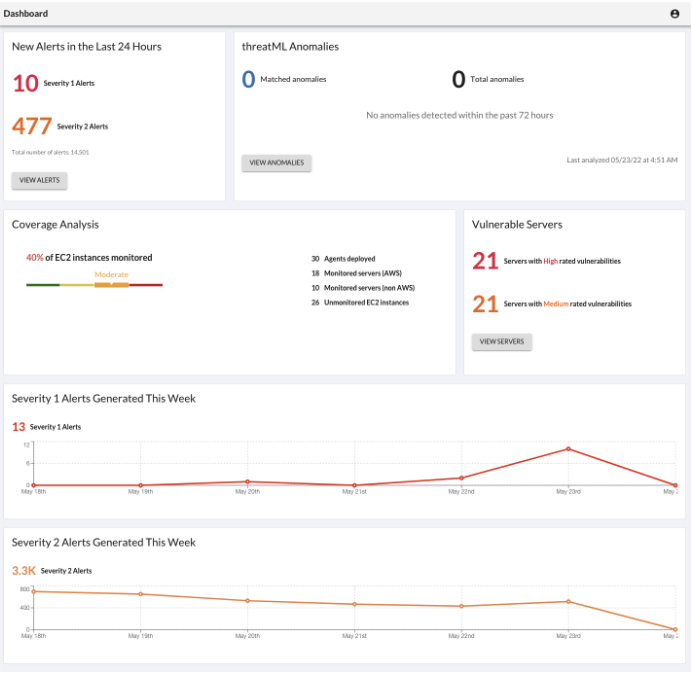
Dashboard
To access the Dashboard, Log into Threat Stack: https://app.threatstack.com/login
In the Email field, type your account email address and click Next.
For the lab enter, StudentN@Acme.com
In the Password field, type your account password and click Next.
For the lab enter, XXXXXXXX
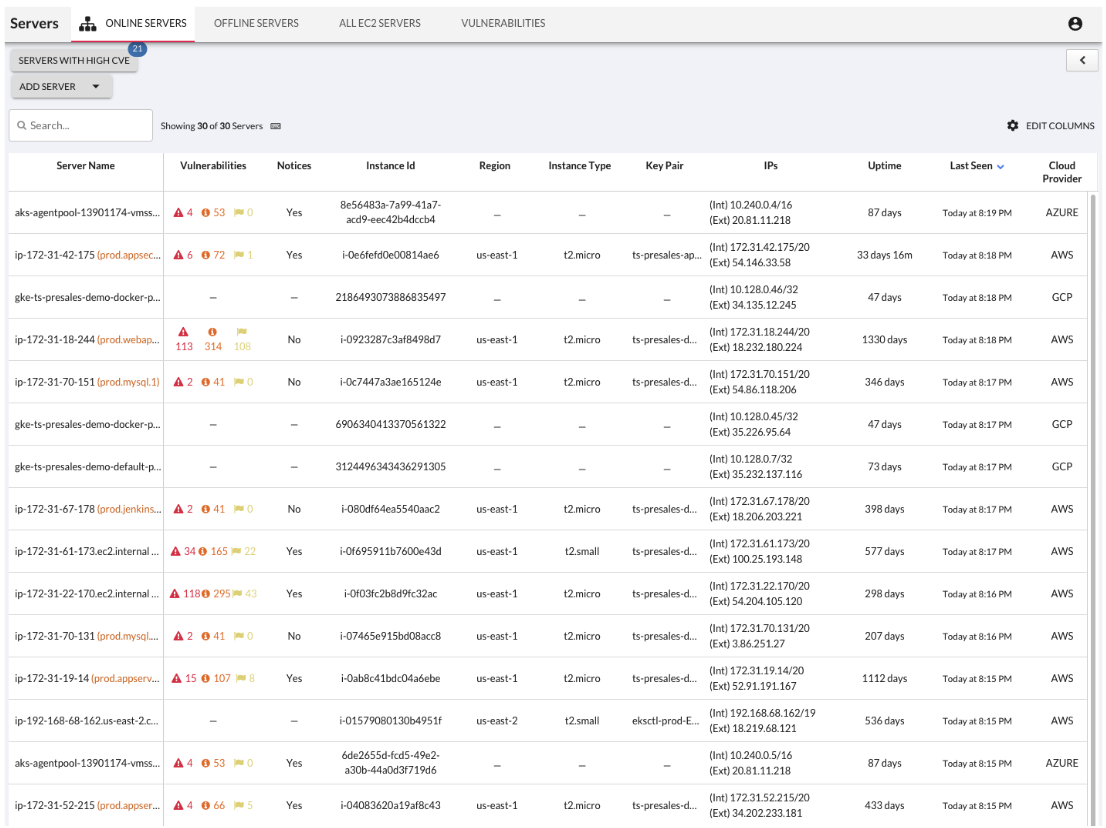
Monitoring
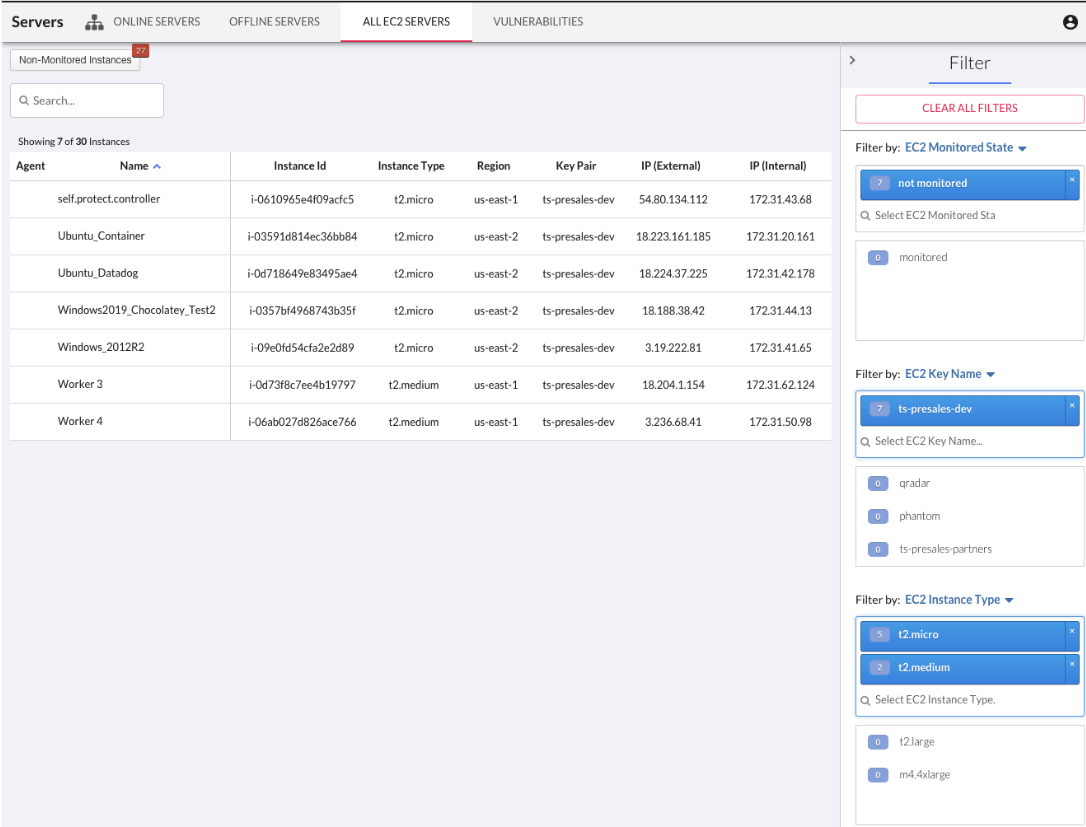
By Selecting, Servers Page, you can filter or change information shown about servers, deploy Agents, and view a list of vulnerabilities found on the servers protected by the Agent.
For more information on other abilities navigate to our Servers Page Feature Walkthrough:
https://threatstack.zendesk.com/hc/en-us/articles/360055728251-Servers-Page
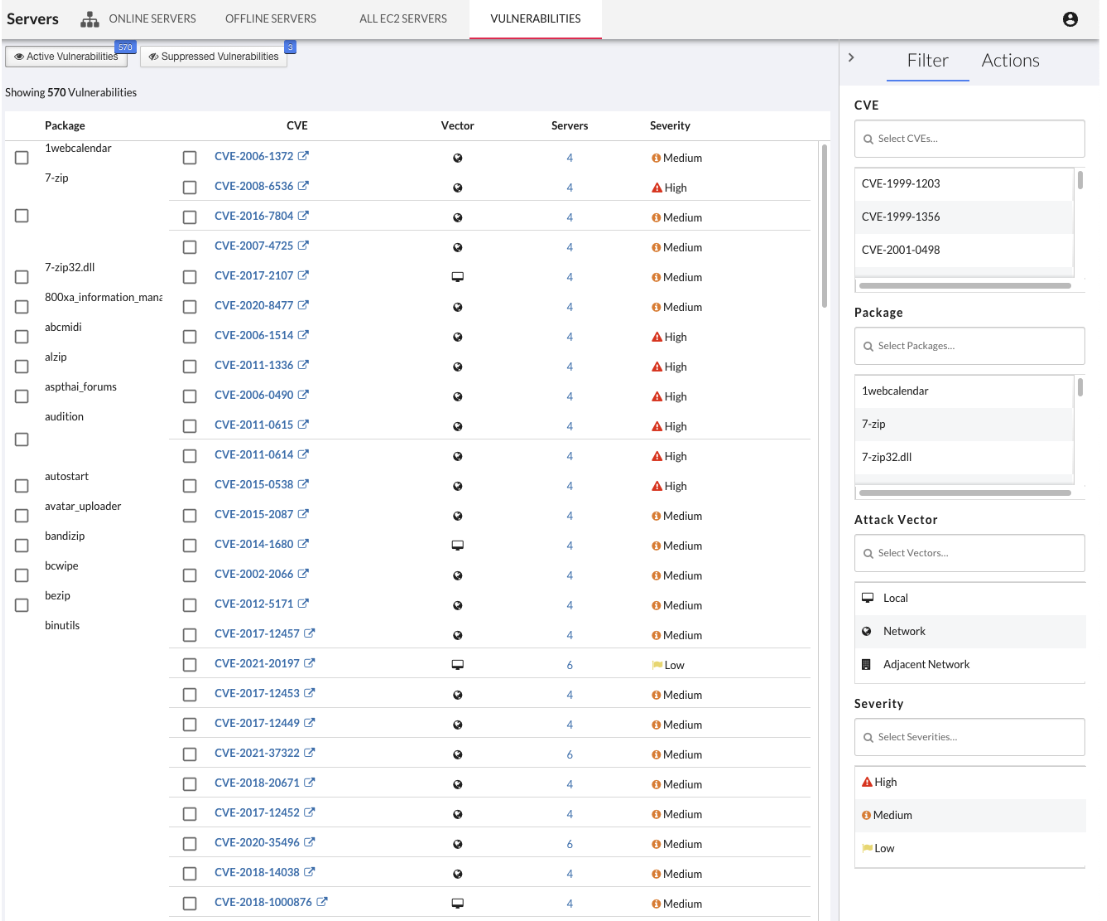
Vulnerabilities
Threat Stack Agent retrieves a list of installed packages on the host each day and matches against all known Common Vulnerabilities & Exposures (CVEs) captured in the National Vulnerability Database (NVD). It then compares them against the published security notice and triage data from the specific Linux distribution.
AWS EC2 Integration
With an Amazon Web Service (AWS) profile integration, the user can see exactly what instances are protected and which are not. The Threat Stack Cloud Security PlatformⓇ (CSP) will always reflect the current state of your infrastructure through continuous scans for instance creation or termination, etc.
Detection
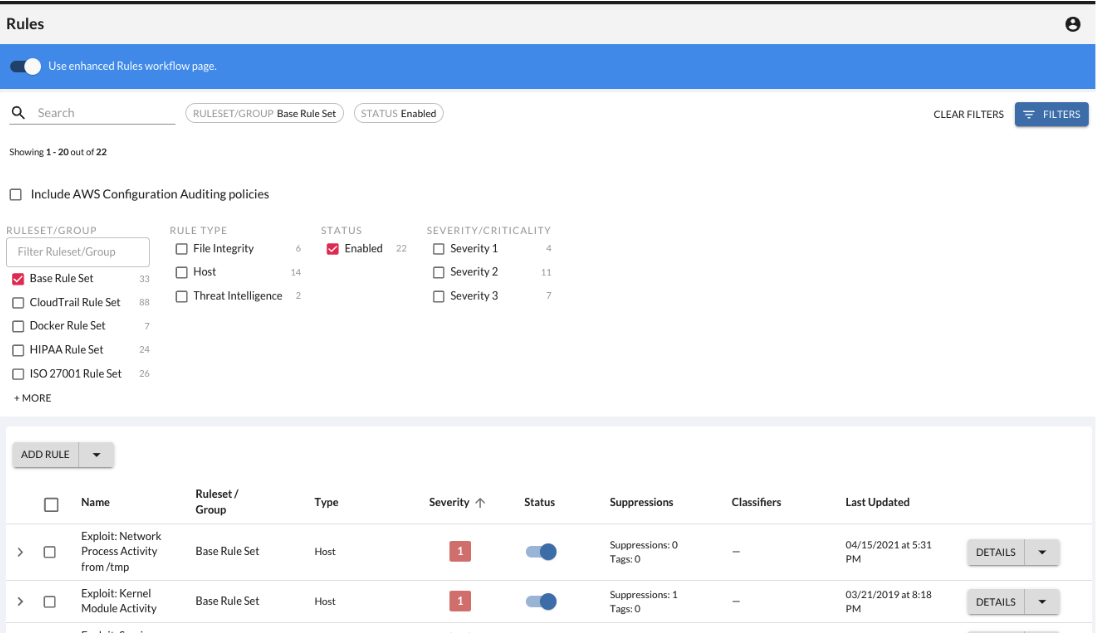
By Selecting, Rules Page, you can review all the included pre-built rules that monitor common threats to any infrastructure. The Base Ruleset has been created by our rules council & SOC team to monitor for the most common attack vectors our experts see on a continuous basis. Due to the complexities of modern infrastructure, we also provide customers with the ability to create custom rules. This provides you with the ability to monitor for behaviors that matter to your unique infrastructure.
Rules Details Overview
Select the options button to view available configurations for the rule selected.
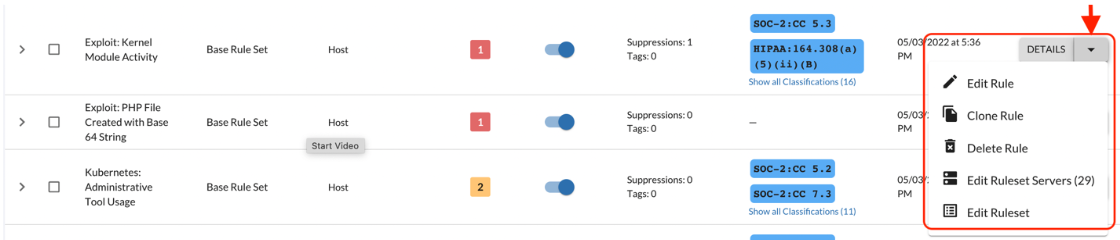
Edit Rule Enable
Edit a rule by selecting the Down Arrow > Edit Rule
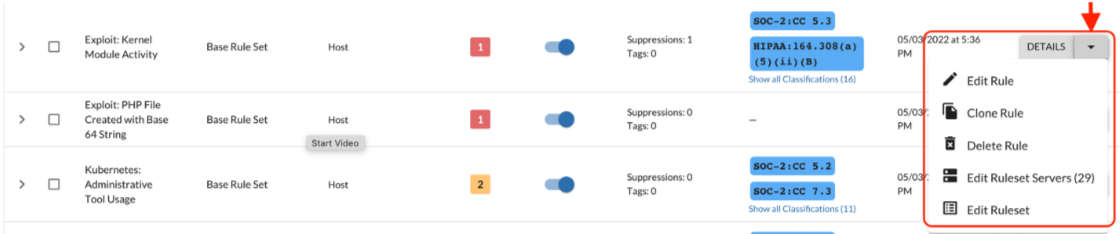
Enable/Disable a Rule
By shifting the Status of the rule, you can Enable or Disable the rule.

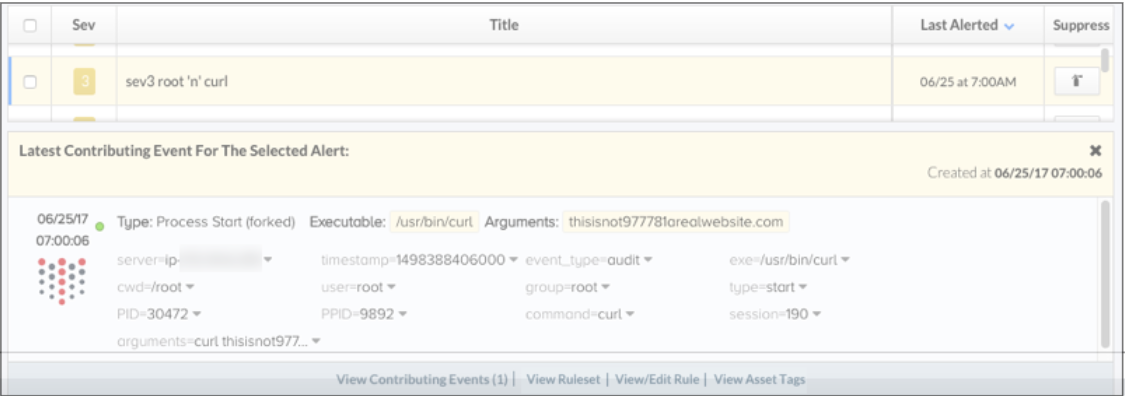
Investigate
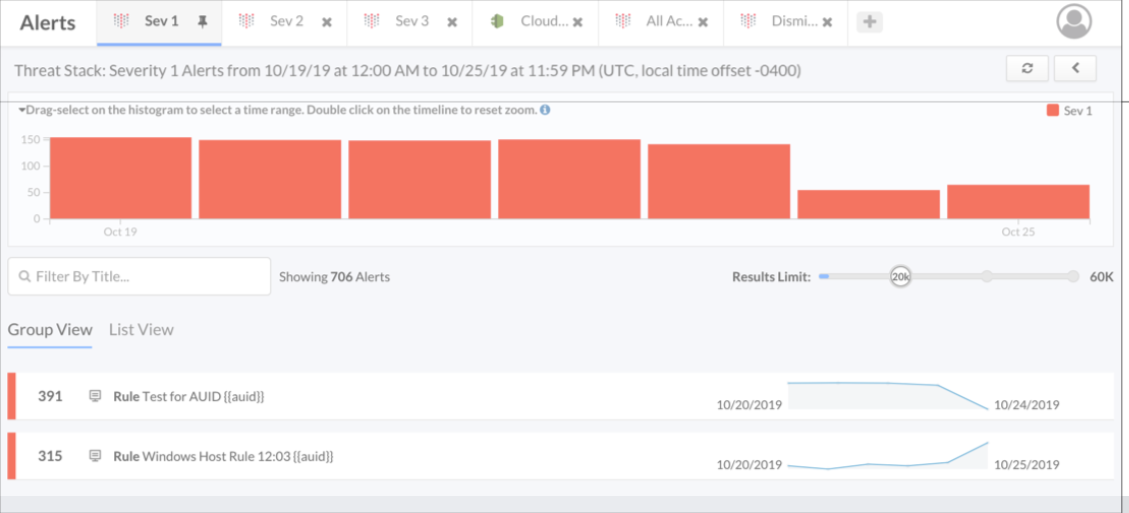
By selecting Alerts, you’ll see an organized list sorted by severity, number of occurrences, and time of occurrence. Our rules are generated in real-time and have a retention period of 365 days. This can help you better track the abnormal spikes of alerts and review the behaviors that caused the events. Additional UI details are defined below.
Tabs as focus areas: We narrowed in on the well-known concept of browser tabs as focus areas, with in-built default tabs and the ability for customers to create and save their own tabs. Each tab can be customized to match the originating rulesets and/or originating servers (EC2 tags).
Live alert loading: The Alerts page displays alerts as they come in. It does not delay the loading of alerts coming into the Threat Stack Cloud Security PlatformⓇ (CSP).
Search on alert titles: All tabs have a “Filter by Title” search field. Results appear as the users type in the words in the search bar.
More detailed information about alert views refer to the documentation below.
https://threatstack.zendesk.com/hc/en-us/articles/205992556-Alert-View
What is an Alert?
Alerts are behavior anomalies elevated from the stream of raw telemetry by rule filters, that do not have a corresponding suppression.